| Description | Years | |||||||||
|---|---|---|---|---|---|---|---|---|---|---|
| 2002 | 2003 | 2004 | 2005 | 2006 | 2007 | 2008 | 2009 | 2010 | 2011 | |
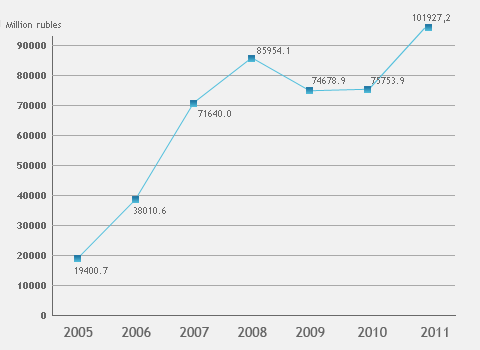
| Fixed investment*, million rubles, total | 18297.8 | 23382.6 | 22640.7 | 19400.7 | 38010.6 | 71640.0 | 85954.1 | 74678.9 | 77598.1 | 101927.2 |
| Fixed investment per capita, rubles | 17465 | 22414 | 21798 | 18738 | 36775 | 69284 | 82911 | 74086 | 72561,2 |
|

From: Statistical Yearbook: Statistics Digest/Tomskstat. Tomsk, 2012
* including informal economy indicators