| thousand USD | % to | |||||||
|---|---|---|---|---|---|---|---|---|
| 2009 | 2010 | 2011 | 2012 | total | ||||
| 2009 | 2010 | 2011 | 2012 | |||||
| Investment – Total | 226203.8 | 236085,1 | 408023.3 |
230070.0 | 100 | 100 | 100 | 100 |
| incl.: | ||||||||
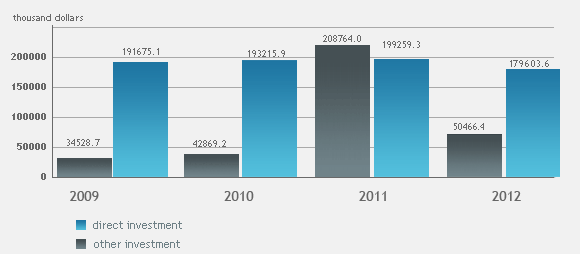
| direct investment | 191675.1 | 193215,9 | 199259.3 |
179603.6 | 84.7 | 81,8 | 48.8 |
78.1 |
| incl.: | ||||||||
| contributions to capital | 51612.2 | 80003,2 | 19207.9 |
29635.0 | 22.8 | 33,9 | 4.7 |
12.9 |
| loans from foreign co-owners of enterprises | 138907.6 | 113211.0 | 180050.5 |
148879.4 | 61.4 | 47,9 | 44.1 |
64.7 |
| other direct investment | 1155.3 | 1,7 | 0.9 |
1089.2 | 0.5 | 0,0 | 0,0 | 0.5 |
| other investment | 34528.7 | 42869,2 | 208764.0 |
50466.4 | 15.3 | 18,2 | 51.2 |
21.9 |
| incl.: | ||||||||
| trade loans | — | — | — | — | — | — | — | — |
| other loans | 34528.7 | 42869,2 | 208764.0 |
50425.7 | 15.3 | 18,2 | 51.2 |
21.9 |

* without data on monetary authorities, commercial and savings banks, including contributions in rubles converted to US dollars
From: Statistical Yearbook, 2012: Statistics Digest/Tomskstat. Tomsk, 2012.